

Macroeconomic Overview
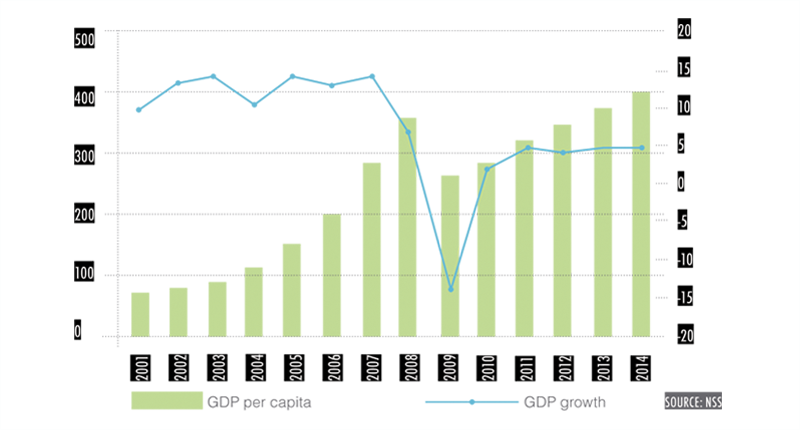
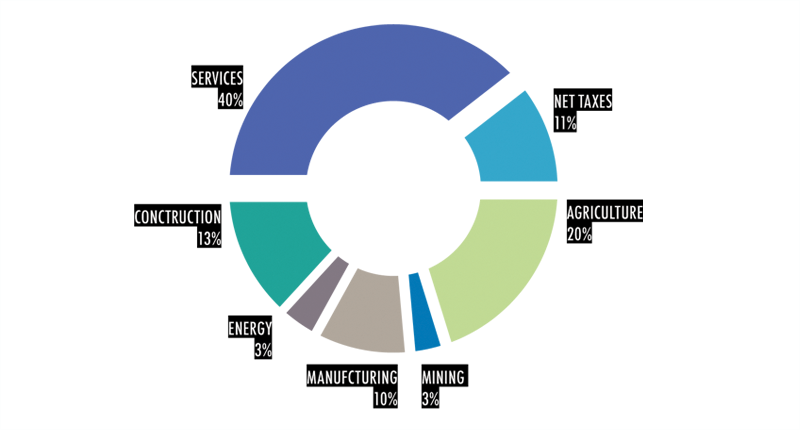
Armenia was ranked frst among CIS and CEE countries in GDP per-capita growth rates from 2000 to 2008. Growth slowed at the end of 2008, and actually declined in 2009, primarily due to the effects of the global economic crisis. But in 2010-2011, the economy experienced renewed growth. The industrial structure of the economy has become more diversifed in recent years as well: services and industry now make up 60 percent of GDP, versus 40 percent prior to the crisis. During the post-crisis period the industrial sector has demonstrated the highest growth rates (15.3%) compared to other sectors. Infation from 2000 to 2008 was relatively low (see Figure 5), but increased in 2010 because of higher food prices in international markets, and a decline in local agricultural production. Monetary tightening stabilized price levels in 2011.
|
FIGURE 3. GDP GROWTH (%) AND GDP PER CAPITA (US $), 2001-2014
|
FIGURE 4. GDP BY SECTORS OF ECONOMY, 2011
|
|
FIGURE 5. INFLATION AND EXCHANGE RATE, 2000-2011
|
FIGURE 8. EXPORT AND IMPORT, 2002-2011
|


|
FIGURE 6. INVESTMENTS BY COUNTRIES, 2011
|
FIGURE 7. MAIN TRADE PARTNERS, 2011
|


Total investment grew by 16.2% in 2011, with strong growth in the telecommunications, mining, food processing, IT and R&D, tourism, airport infrastructure, energy generation and distribution sectors. Foreign direct investment (FDI) fows to the Armenian economy mainly originated from Russia, EU member states and the U.S. Armenia’s exports are concentrated in base metals (copper, molybdenum, gold), cut diamonds, and food and beverages (canned and fresh food, brandy). The principal import commodities are natural gas, petroleum, tobacco products, foodstuffs, diamonds, machinery and equipment.
TABLE 1. MAIN MACROECONOMIC INDICATORS, 2008-2012
| 2008 | 2009 | 2010 | 2011 | 2012* | |
|---|---|---|---|---|---|
| GDP (USD billion) | 11.7 | 8.7 | 9.3 | 10.1 | 11.3 |
| GDP per capita (USD) | 3,606 | 2,666 | 2,844 | 3,102 | 3,454 |
| GDP real growth, % | 6.9 | -14.1 | 2.1 | 4,7 | 4.2 |
| Industry | 2.1 | -6.9 | 9.2 | 13.5 | 6.4 |
| Agriculture | 3.3 | 6.0 | -16.0 | 13.7 | 4.0 |
| Construction | 11.3 | -41.6 | 3.3 | -12.5 | 2.5 |
| Services | 4.8 | -3.3 | 4.1 | 5.0 | 4.1 |
| Inflation (year-end) | 5.2 | 6.5 | 9.4 | 4.7 | 4.1 |
| Budget balance (% of GDP) | -0.7 | -7.6 | -5.0 | -3.0 | -3.1 |
| Officially registered unemployment, % (year-end) | 6.3 | 7.0 | 7.0 | 6.2 | 6.2 |
| Investment (USD million) | 1,257.6 | 935.5 | 702.6 | 816.3 | - |
| incl. FDI (USD million) | 1,000.9 | 732.1 | 483.0 | 631.4 | - |
| Exports FOB (USD million) | 1,057.2 | 710.2 | 1,041.1 | 1,329.5 | 1,509 |
| Imports CIF (USD million) | 4,426.1 | 3,321.1 | 3,749.0 | 4,151.4 | 4,367 |
| Foreign Exchange Reserves (USD billion) | 1.41 | 2.00 | 1.87 | 1.96 | - |
| USD/AMD exchange rate (average) | 306.0 | 363.3 | 373.7 | 372.5 | - |
SOURCE: NSS, MOF RA
* Provided fgures are preliminary estimation done at the end of 2011. According to recent estimations the real growth of GDP is considered to be 7%.


")


